Authors:
(1) Vinod S. Khandkar and Manjesh K. Hanawal, Industrial Engineering and Operations Research Indian Institute of Technology Bombay, Mumbai, India and {vinod.khandkar, mhanawal}@iitb.ac.in.
Table of Links
Challenges in TD Detection Measurement Setup Development
Case Study : Wehe - TD Detection Tool for Mobile Environment
Shortcoming of Wehe on HTTPS Traffic
III. CHALLENGES IN TD DETECTION MEASUREMENT SETUP DEVELOPMENT
A setup for detecting TD primarily consist of probing traffic generator, traffic data capturing system, and TD detection engine. In this section we describe challenges in engineering each of the components.
A. Network responses
The network response to the probing traffic is a fundamental input to the TD detection mechanism. The type of network response is dependent on the underlying methodology of the tool. Once fixed, the expected response from the network changes with the network configurations. Often, network nodes do not respond as expected to network management messages or do not classify the probing traffic in a specific manner. It happens either due to provisions in the associated Internet standard to deviate from the typical response or due to network policies for network resource management that are proprietary on which Internet standards do not have any control.
Efficient network resource management is crucial for networks. It is exercised through various network middle-boxes across networks using network management practices (TMPs). These devices use either Deep Packet Inspection (DPI) [24] based or Deep Flow Inspection (DFI) [25] based traffic classification for applying TMPs.

We validated the traffic classification of traffic flows from the YouTube server using commercial traffic shaper as shown in Fig. 3. Our validation setup consists of a user-client capable of downloading the content from a given service’s original server (e.g. Gmail server). The traffic shaper is placed in-line between the user-client and YouTube server for validating the traffic classification of data traffic flow. The traffic classification of traffic flow using user-client and accessing it using internet browser are recorded using commercial traffic shaper’s user interface.
Fig. 2 shows the outcome of experiments as visible in commercial traffic shaper’s user interface. The experiments are performed using an internet browser and user-client without performing TLS handshake same as that of performed by Internet browser. The traffic shaper user-interface window shows the internet traffic activity for last 10 mins in the left window and service-wise classification of internet traffic in the right window. The commercial traffic shaper successfully detects the Gmail traffic for experiments using the internet browser (Fig. 2(a)). However, it could not detect any Gmail traffic for the experiment using user-client. The traffic shaper rather wrongly detects Gmail’s traffic as YouTube traffic in the latter experiment ( Fig. 2(b)).
It indicates that commercial traffic shaper is always able to classify the Internet traffic correctly if accessed using Internet browser. However, the traffic classification is inconsistent or sometimes wrong in traffic characteristics based classification. As mentioned earlier, the traffic classification governs the network response. Thus generating a network response similar to that of the original service is a challenging task. .
B. TD Detection
The TD detection algorithm is the core engine of the measurement setup for TD detection. Most of the time, it needs a specific type of input for its proper operations that is derived from the observed network response. The average throughput curves of probing traffic or specific traffic characteristics of sequence of network management response packets such as inter-packet times are examples of input information. TD detection involves the comparison of such specific network response across different traffic streams. However, these network response may vary across services due to different reasons without being subjected to deliberate traffic differentiation.
The end-to-end connection between client and server for the Internet services is not dedicated. The best-effort nature of the IP layer packet forwarding results in packets from the same traffic stream to take different paths having different congestion environment. The performance comparison of streams experiencing different congestion is not reliable.
Internet services employ various mechanisms to cope with the fluctuation in available bandwidth to provide a seamless end-user experience. Dynamic adaptive streaming over HTTP (DASH) is one such technique that modifies traffic characteristics such as speed or content characteristics such as coding rate. Each streaming service uses tailored techniques as per their requirements, and they are proprietary [27]. Measurement setups such as passive monitoring systems face this challenge of normalizing various streaming services’ performances for their difference in bandwidth fluctuation coping techniques. While active probing method overcome this issue using customised DASH or traffic replay, their probing traffic tends to saturates the available bandwidth, similar to point-to-point (p2p) traffic. Such traffic streams may lose their relevance as original service traffic.
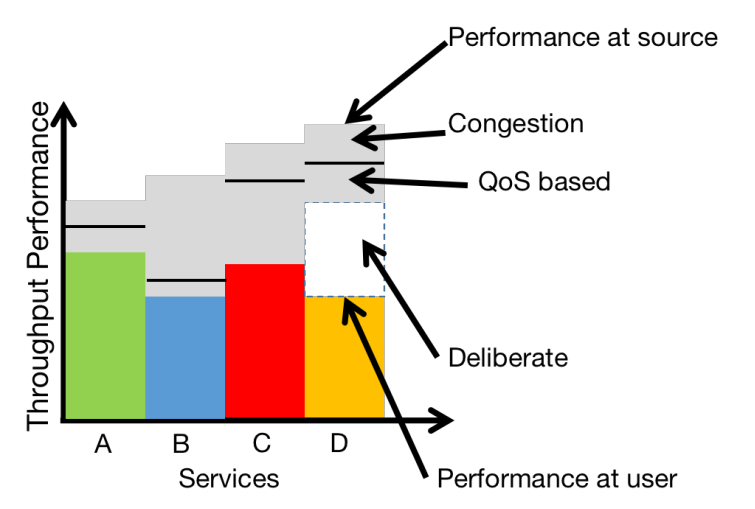
The network middle-boxes applies QoS-based traffic management practices (TMPs) to efficiently allocate network resources across different types of services while maintaining the their bandwidth requirement. Thus different types of services may be allocated different bandwidths depending on the current network load and one has to take into account various confounding factors.
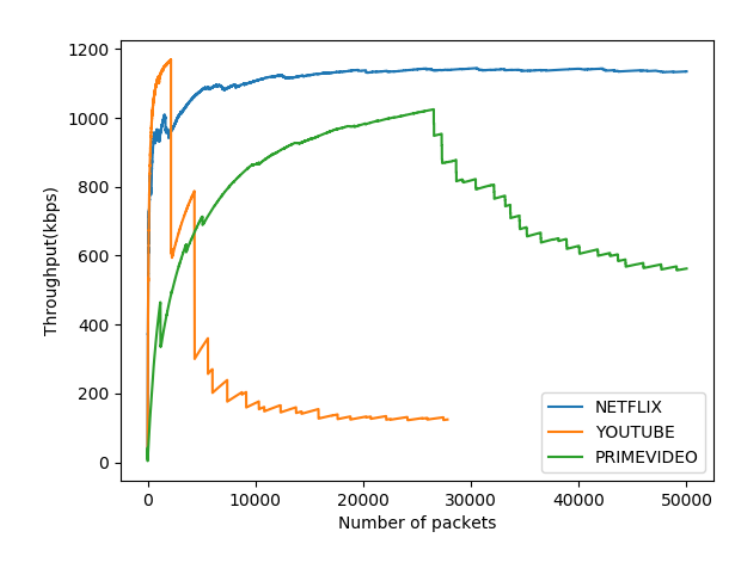
Fig. 4 shows the effect of various confounding factors on the performances of Internet services (named A,B,C,D). In the figure, total height of each bar (consisting of the colored and grayed portion) shows throughput for each streaming service as governed by the transmission strategy (DASH in case of streaming services) of their servers. The colored portion (other than grey) shows the throughput experienced at the client-side. The grey portion is the throughput lost in the network – the upper part of the grayed portion shows the throughput lost due to network congestion and the lower grayed portion shows that lost due to network traffic management. Note that the server of each stream could be sending the traffic at different rates with their own proprietary DASH and that received by user-clients depend on the different levels of degradation the streams experience in the networks. The white portion in the throughput performance bar of service D shows throughput lost due to deliberate degradation. Identifying this discrimination of stream D just by comparing the throughout experienced at the user-client will be misleading due to non-uniformity in the transmission rates at the source and network effects. We validated this aspect using three different streaming services namely Netflix, YouTube, and PrimeVideo. We plotted the average running throughput for these services for their traffic as shown in Fig. 5. It can be seen that each service is fetching the data differently depending on their congestion environment and server’s data transmission schemes i.e. DASH. Thus the performances of these services are comparable without normalising the effect of confounding factors.
The normalisation of effects of all confounding factors poses challenge in case of TD detection based on comparing network


responses across services.
C. Other challenges
Internet services use a specific port number for communication. It is as per port reservations defined in Internet standards [28], e.g., port 80 for HTTP traffic and 22 for SSH (Secure Shell ) traffic. Thus the port number used in the transmission of probing data plays a vital role in traffic classification by network middle-boxes [29]. Using correct data to be used on the pre-assigned port number for a given service and making it as authentic as original service’s traffic stream is a challenging task. It requires a thorough understanding of network traffic classification on that port.
This paper is available on arxiv under CC 4.0 license.

